Friday, December 27, 2013

Latest SQL Anywhere Updates: 12.0.1.4006 for Mac OS

Current builds for the active platforms...

HP-UX     16.0.0.1691 (EBF 22263 SP6)        11 Dec 2013
 Itanium  12.0.1.3994 (EBF 22137 SP66)       02 Dec 2013
          11.0.1.2958 (EBF 21793 SP96)       08 Apr 2013     End of Life 31 May 2014

IBM AIX   16.0.0.1691 (EBF 22262 SP6)        11 Dec 2013
          12.0.1.3994 (EBF 22136 SP66)       02 Dec 2013
          11.0.1.2958 (EBF 21792 SP96)       08 Apr 2013     End of Life 31 May 2014

Linux     16.0.0.1691 (EBF 21981 SP6)        31 Oct 2013
          On Demand 1.0.4613 (SP3)           13 Sep 2013
          12.0.1.3994 (EBF 22111 SP66)       27 Nov 2013
          12.0.1 Chinese,                    16 Apr 2013
                 Japanese Docs (Eclipse)     16 Apr 2013
          11.0.1.3027 (EBF 21786 SP98)       13 Sep 2013     End of Life 31 May 2014

Mac OS    16.0.0.1565 (EBF 21800 SP3)        13 Sep 2013
          12.0.1.4006 (EBF 22318 SP67)   *** 24 Dec 2013 ***
          11.0.1.2449 Update                 29 Jun 2010     End of Life 31 May 2014

Solaris   16.0.0.1691 (EBF 22267 SP6)        11 Dec 2013
 SPARC    12.0.1.3994 (EBF 22138 SP66)       03 Dec 2013
          11.0.1.2958 (EBF 21794 SP96)       08 Apr 2013     End of Life 31 May 2014

Solaris   16.0.0.1691 (EBF 22265 SP6)        11 Dec 2013
 x64      12.0.1.3994 (EBF 22139 SP66)       02 Dec 2013
          11.0.1.2958 (EBF 21750 SP96)       08 Apr 2013     End of Life 31 May 2014

Windows   16.0.0.1691 (EBF 21980 SP6)        31 Oct 2013
          On Demand 1.0.4613 (SP3)           13 Sep 2013
          12.0.1.3994 (EBF 22109 SP66)       27 Nov 2013
          12.0.1 French,                     25 Sep 2012
                 English,                    25 Sep 2012
                 German,                     25 Sep 2012
                 Chinese,                    28 Mar 2013
                 Japanese Docs (HTML/PDF)    28 Mar 2013
          11.0.1.3069 (EBF 22299 SP99)       19 Dec 2013     End of Life 31 May 2014 

Other Stuff...

 Older Updates

 Free support! Q&A forum
   ...or, call Tech Support

 SQL Anywhere...
   ...Sybase home page 
   ...SAP home page 
   ...SAP Developer Center 

 Buy SQL Anywhere 

 Developer Edition... 
   [16.0] [12.0.1] [11.0.1]

 Download the...
   Educational Edition 
   Web Edition 

 Supported Platforms...
   SQL Anywhere 
   Linux 
   OnDemand

 ODBC Drivers for MobiLink

The asterisks "***" show which items have appeared on the Sybase website since the previous version of this page.
  • Only the latest fully-supported versions of SQL Anywhere (11.0.1, 12.0.1, 16.0 and On Demand) are shown here.

  • The "EBF 21788 SP60" numbers are the new SAP-specific codes associated with the build numbers "12.0.1.3894".

  • Just because an older version or different platform isn't "fully supported" any more doesn't mean you can't download files (or ask questions, or get help), it just means there won't be any more new Updates released.

Friday, December 20, 2013

Latest SQL Anywhere Updates: 11.0.1.3069 for Windows

Current builds for the active platforms...

HP-UX     16.0.0.1691 (EBF 22263 SP6)        11 Dec 2013
 Itanium  12.0.1.3994 (EBF 22137 SP66)       02 Dec 2013
          11.0.1.2958 (EBF 21793 SP96)       08 Apr 2013     End of Life 31 May 2014

IBM AIX   16.0.0.1691 (EBF 22262 SP6)        11 Dec 2013
          12.0.1.3994 (EBF 22136 SP66)       02 Dec 2013
          11.0.1.2958 (EBF 21792 SP96)       08 Apr 2013     End of Life 31 May 2014

Linux     16.0.0.1691 (EBF 21981 SP6)        31 Oct 2013
          On Demand 1.0.4613 (SP3)           13 Sep 2013
          12.0.1.3994 (EBF 22111 SP66)       27 Nov 2013
          12.0.1 Chinese,                    16 Apr 2013
                 Japanese Docs (Eclipse)     16 Apr 2013
          11.0.1.3027 (EBF 21786 SP98)       13 Sep 2013     End of Life 31 May 2014

Mac OS    16.0.0.1565 (EBF 21800 SP3)        13 Sep 2013
          12.0.1.3958 (EBF 21796 SP64)       19 Sep 2013
          11.0.1.2449 Update                 29 Jun 2010     End of Life 31 May 2014

Solaris   16.0.0.1691 (EBF 22267 SP6)        11 Dec 2013
 SPARC    12.0.1.3994 (EBF 22138 SP66)       03 Dec 2013
          11.0.1.2958 (EBF 21794 SP96)       08 Apr 2013     End of Life 31 May 2014

Solaris   16.0.0.1691 (EBF 22265 SP6)        11 Dec 2013
 x64      12.0.1.3994 (EBF 22139 SP66)       02 Dec 2013
          11.0.1.2958 (EBF 21750 SP96)       08 Apr 2013     End of Life 31 May 2014

Windows   16.0.0.1691 (EBF 21980 SP6)        31 Oct 2013
          On Demand 1.0.4613 (SP3)           13 Sep 2013
          12.0.1.3994 (EBF 22109 SP66)       27 Nov 2013
          12.0.1 French,                     25 Sep 2012
                 English,                    25 Sep 2012
                 German,                     25 Sep 2012
                 Chinese,                    28 Mar 2013
                 Japanese Docs (HTML/PDF)    28 Mar 2013
          11.0.1.3069 (EBF 22299 SP99)   *** 19 Dec 2013 *** End of Life 31 May 2014 

Other Stuff...

 Older Updates

 Free support! Q&A forum
   ...or, call Tech Support

 SQL Anywhere...
   ...Sybase home page 
   ...SAP home page 
   ...SAP Developer Center 

 Buy SQL Anywhere 

 Developer Edition... 
   [16.0] [12.0.1] [11.0.1]

 Download the...
   Educational Edition 
   Web Edition 

 Supported Platforms...
   SQL Anywhere 
   Linux 
   OnDemand

 ODBC Drivers for MobiLink

The asterisks "***" show which items have appeared on the Sybase website since the previous version of this page.
  • Only the latest fully-supported versions of SQL Anywhere (11.0.1, 12.0.1, 16.0 and On Demand) are shown here.

  • The "EBF 21788 SP60" numbers are the new SAP-specific codes associated with the build numbers "12.0.1.3894".

  • Just because an older version or different platform isn't "fully supported" any more doesn't mean you can't download files (or ask questions, or get help), it just means there won't be any more new Updates released.

Wednesday, December 18, 2013

Don't Confuse LastPlanText With LastStatement

Here's how the SQL Anywhere 16 Help describes the LastPlanText and LastStatement connection properties:


LastPlanText Returns the long text plan of the last query executed on the connection. You control the remembering of the last plan by setting the RememberLastPlan option of the sa_server_option system procedure, or using the -zp server option. See -zp database server option.

LastStatement Returns the most recently prepared SQL statement for the current connection.

The LastStatement value is set when a statement is prepared, and is cleared when a statement is dropped. Only one statement string is remembered for each connection.

If sa_conn_activity reports a non-empty value for a connection, it is most likely the statement that the connection is currently executing. If the statement had completed, it would likely have been dropped and the property value would have been cleared. If an application prepares multiple statements and retains their statement handles, then the LastStatement value does not reflect what a connection is currently doing.

When client statement caching is enabled, and a cached statement is reused, this property returns an empty string.

It's easy to assume both properties apply to the same SQL statement, and they often do... but they don't have to. Here's an example using the code from this article:
CREATE PROCEDURE p()
BEGIN

WAITFOR DELAY '00:00:01';

SELECT COUNT_BIG(*) 
  FROM SYSTAB AS A 
       CROSS JOIN SYSTABCOL AS B
       CROSS JOIN SYSUSER AS C;

END;

SELECT * FROM p();
This Foxhound snapshot shows SELECT * FROM p() as the Last Statement value, but the Last Plan Text applies to a different statement, the SELECT COUNT_BIG(*) statement inside the stored procedure:


That's the difference between these two connection properties:
  • LastStatement shows what came from the client application,

  • whereas LastPlanText applies to the last query run by the server whether it came from the client or (in this case) came from within a stored procedure.

Are you SURE about that?

Question: Is it possible the behavior of LastPlanText and LastStatement in the example above is related to peculiar symptoms described in Beware The Slow Result Set Query and Hunting The Slow Result Set Query where the SELECT statement used to return a result set didn't show up at all in the procedure profiler and was fairly well hidden in the database tracing output?

Answer: Let's run a test with a stored procedure that contains time-consuming queries but doesn't return a result set at all:
CREATE PROCEDURE p ( OUT @x INTEGER )
BEGIN
DECLARE @y INTEGER;

SELECT COUNT_BIG(*) 
  INTO @x
  FROM SYSUSER AS A 
       CROSS JOIN SYSUSER AS B
       CROSS JOIN SYSUSER AS C 
       CROSS JOIN SYSUSER AS D;

SELECT COUNT_BIG(*) 
  INTO @y
  FROM SYSTAB AS A 
       CROSS JOIN SYSTABCOL AS B
       CROSS JOIN SYSUSER AS C;

SET @x = @x + @y;

END;

CREATE OR REPLACE VARIABLE @x INTEGER;
CALL p ( @x );
SELECT @x;
When execution hit the first slow SELECT INTO @x statement, Foxhound showed that LastStatement contains the CALL statement but LastPlanText showed the plan for the SELECT:


When the next slow SELECT INTO @y started executing, Foxhound still showed the CALL in LastStatement, but LastPlanText contained the plan for the next SELECT:


That pretty much confirms LastStatement is a client statement thing whereas LastPlanText follows the plans wherever they may be coming from, client or server.

Note: The "Show More" and "Show Less" buttons will be available in Foxhound Version 3 when it is released.

Monday, December 16, 2013

Latest SQL Anywhere Updates: 16.0.0.1691 HP-UX, IBM AIX and Solaris

Current builds for the active platforms...

HP-UX     16.0.0.1691 (EBF 22263 SP6)    *** 11 Dec 2013 ***
 Itanium  12.0.1.3994 (EBF 22137 SP66)       02 Dec 2013
          11.0.1.2958 (EBF 21793 SP96)       08 Apr 2013     End of Life 31 May 2014

IBM AIX   16.0.0.1691 (EBF 22262 SP6)    *** 11 Dec 2013 ***
          12.0.1.3994 (EBF 22136 SP66)       02 Dec 2013
          11.0.1.2958 (EBF 21792 SP96)       08 Apr 2013     End of Life 31 May 2014

Linux     16.0.0.1691 (EBF 21981 SP6)        31 Oct 2013
          On Demand 1.0.4613 (SP3)           13 Sep 2013
          12.0.1.3994 (EBF 22111 SP66)       27 Nov 2013
          12.0.1 Chinese,                    16 Apr 2013
                 Japanese Docs (Eclipse)     16 Apr 2013
          11.0.1.3027 (EBF 21786 SP98)       13 Sep 2013     End of Life 31 May 2014

Mac OS    16.0.0.1565 (EBF 21800 SP3)        13 Sep 2013
          12.0.1.3958 (EBF 21796 SP64)       19 Sep 2013
          11.0.1.2449 Update                 29 Jun 2010     End of Life 31 May 2014

Solaris   16.0.0.1691 (EBF 22267 SP6)    *** 11 Dec 2013 ***
 SPARC    12.0.1.3994 (EBF 22138 SP66)       03 Dec 2013
          11.0.1.2958 (EBF 21794 SP96)       08 Apr 2013     End of Life 31 May 2014

Solaris   16.0.0.1691 (EBF 22265 SP6)    *** 11 Dec 2013 ***
 x64      12.0.1.3994 (EBF 22139 SP66)       02 Dec 2013
          11.0.1.2958 (EBF 21750 SP96)       08 Apr 2013     End of Life 31 May 2014

Windows   16.0.0.1691 (EBF 21980 SP6)        31 Oct 2013
          On Demand 1.0.4613 (SP3)           13 Sep 2013
          12.0.1.3994 (EBF 22109 SP66)       27 Nov 2013
          12.0.1 French,                     25 Sep 2012
                 English,                    25 Sep 2012
                 German,                     25 Sep 2012
                 Chinese,                    28 Mar 2013
                 Japanese Docs (HTML/PDF)    28 Mar 2013
          11.0.1.2960 (EBF 21751 SP97)       16 Apr 2013     End of Life 31 May 2014 

Other Stuff...

 Older Updates

 Free support! Q&A forum
   ...or, call Tech Support

 SQL Anywhere...
   ...Sybase home page 
   ...SAP home page 
   ...SAP Developer Center 

 Buy SQL Anywhere 

 Developer Edition... 
   [16.0] [12.0.1] [11.0.1]

 Download the...
   Educational Edition 
   Web Edition 

 Supported Platforms...
   SQL Anywhere 
   Linux 
   OnDemand

 ODBC Drivers for MobiLink

The asterisks "***" show which items have appeared on the Sybase website since the previous version of this page.
  • Only the latest fully-supported versions of SQL Anywhere (11.0.1, 12.0.1, 16.0 and On Demand) are shown here.

  • The "EBF 21788 SP60" numbers are the new SAP-specific codes associated with the build numbers "12.0.1.3894".

  • Just because an older version or different platform isn't "fully supported" any more doesn't mean you can't download files (or ask questions, or get help), it just means there won't be any more new Updates released.

Friday, December 13, 2013

Hunting The Slow Result Set Query

An earlier article Beware The Slow Result Set Query described how SQL Anywhere's stored procedure profiler doesn't highlight, or even report, the time spent executing SELECT statements that return result sets from stored procedures.

SQL Anywhere's Database Tracing feature does a bit better than the procedure profiler, but it can be somewhat confusing. Here's a demonstration using the same procedure as before:

CREATE PROCEDURE p()
BEGIN

WAITFOR DELAY '00:00:01';

SELECT COUNT_BIG(*) 
  FROM SYSTAB AS A 
       CROSS JOIN SYSTABCOL AS B
       CROSS JOIN SYSUSER AS C;

END;

SELECT * FROM p();

Let's pretend!

You and I both know where the time is going in this trivial procedure, but let's pretend that's not the case... let's pretend this code is part of a giant application and we don't know where the time is going.

Here's what the Database Tracing shows after a test run:


The first line in the Summary list tells us what ISQL told us before, but the procedure profiler didn't: that SELECT * FROM p() takes a long time to run (Total Time 179,079 milliseconds).

Unlike the procedure profiler, however, the Database Tracing feature captures graphical plans for all the time-consuming queries. Here's the plan for SELECT * FROM p(); it shows that the procedure call is taking all the time (Runtime 179.08 seconds):


Clearly, it can't be the procedure call itself that's taking the time, it must be something the procedure is doing... and it's only doing two things, a WAITFOR statement and a SELECT COUNT_BIG(*).

The Database Tracing Summary list doesn't show the WAITFOR statement at all, even though the procedure profiler previously reported that it took over 1,000 milliseconds. But never mind, it doesn't really matter if Database Tracing doesn't capture WAITFOR delays, what about the SELECT COUNT_BIG(*)?

Yes, there it is, line 12 in the Summary list shows that the SELECT COUNT_BIG(*) was executed twice (huh? oh, never mind) for a total time of 74 milliseconds.

Now, if this was a real example, and line 12 was one of many hundreds or thousands of queries in the Database Tracing Summary list, it might go unnoticed... 74 milliseconds is nothing.

It's not nothing!

It turns out that "74 milliseconds" is a complete fiction; the graphical plan for the SELECT COUNT_BIG(*) tells a whole different story:


This plan tells the real story: the Node Statistics FirstRowRunTime is 177.99 seconds, and that's backed up by the Subtree Statistics Runtime of 177.99 seconds.

Nobody runs Database Tracing on trivial applications

Here's the point of this exercise: When you're having trouble finding out exactly where the time is going in a big application, look for time-consuming stored procedure result set queries. Look at the code, and drill down into the plans captured by Database Tracing, or go Old School with the GRAPHICAL_PLAN() function.


Wednesday, December 11, 2013

Latest SQL Anywhere Updates: 12.0.1.3994 Solaris SPARC

Current builds for the active platforms...

HP-UX     16.0 GA Dev Edition download       (date n/a)      Dev Edition registration
 Itanium  12.0.1.3994 (EBF 22137 SP66)       02 Dec 2013
          11.0.1.2958 (EBF 21793 SP96)       08 Apr 2013     End of Life 31 May 2014

IBM AIX   16.0 GA Dev Edition download       (date n/a)      Dev Edition registration
          12.0.1.3994 (EBF 22136 SP66)       02 Dec 2013
          11.0.1.2958 (EBF 21792 SP96)       08 Apr 2013     End of Life 31 May 2014

Linux     16.0.0.1691 (EBF 21981 SP6)        31 Oct 2013
          On Demand 1.0.4613 (SP3)           13 Sep 2013
          12.0.1.3994 (EBF 22111 SP66)       27 Nov 2013
          12.0.1 Chinese,                    16 Apr 2013
                 Japanese Docs (Eclipse)     16 Apr 2013
          11.0.1.3027 (EBF 21786 SP98)       13 Sep 2013     End of Life 31 May 2014

Mac OS    16.0.0.1565 (EBF 21800 SP3)        13 Sep 2013
          12.0.1.3958 (EBF 21796 SP64)       19 Sep 2013
          11.0.1.2449 Update                 29 Jun 2010     End of Life 31 May 2014

Solaris   16.0 GA Dev Edition download       (date n/a)      Dev Edition registration
 SPARC    12.0.1.3994 (EBF 22138 SP66)   *** 03 Dec 2013 ***
          11.0.1.2958 (EBF 21794 SP96)       08 Apr 2013     End of Life 31 May 2014

Solaris   16.0 GA Dev Edition download       (date n/a)      Dev Edition registration
 x64      12.0.1.3994 (EBF 22139 SP66)       02 Dec 2013
          11.0.1.2958 (EBF 21750 SP96)       08 Apr 2013     End of Life 31 May 2014

Windows   16.0.0.1691 (EBF 21980 SP6)        31 Oct 2013
          On Demand 1.0.4613 (SP3)           13 Sep 2013
          12.0.1.3994 (EBF 22109 SP66)       27 Nov 2013
          12.0.1 French,                     25 Sep 2012
                 English,                    25 Sep 2012
                 German,                     25 Sep 2012
                 Chinese,                    28 Mar 2013
                 Japanese Docs (HTML/PDF)    28 Mar 2013
          11.0.1.2960 (EBF 21751 SP97)       16 Apr 2013     End of Life 31 May 2014 

Other Stuff...

 Older Updates

 Free support! Q&A forum
   ...or, call Tech Support

 SQL Anywhere...
   ...Sybase home page 
   ...SAP home page 
   ...SAP Developer Center 

 Buy SQL Anywhere 

 Developer Edition... 
   [16.0] [12.0.1] [11.0.1]

 Download the...
   Educational Edition 
   Web Edition 

 Supported Platforms...
   SQL Anywhere 
   Linux 
   OnDemand

 ODBC Drivers for MobiLink

The asterisks "***" show which items have appeared on the Sybase website since the previous version of this page.
  • Only the latest fully-supported versions of SQL Anywhere (11.0.1, 12.0.1, 16.0 and On Demand) are shown here.

  • The "EBF 21788 SP60" numbers are the new SAP-specific codes associated with the build numbers "12.0.1.3894".

  • Just because an older version or different platform isn't "fully supported" any more doesn't mean you can't download files (or ask questions, or get help), it just means there won't be any more new Updates released.

Monday, December 9, 2013

Beware The Slow Result Set Query

When using the procedure profiler in SQL Anywhere, it is easy to miss long-running queries that build the result sets returned by stored procedure calls. The code for these queries is located inside the stored procedure, but the procedure profiler reports the time spent executing them as zero.

Tip: Here's how to launch the SQL Anywhere 16 procedure profiler in Sybase Central:
  • Connect to the target database.

  • Click on the Mode menu item, then

  • click on Application Profiling.

  • The Application Profiling frame will appear at the bottom of the window.

  • Check Stored procedure, function, trigger, or event execution time, then

  • click Finish.

  • The Profiling Stored Procedures, Function, Triggers, and Events display will appear.
To see the profile results:
  • Run your tests,

  • click on View - Refresh All, then

  • look in the Profiling Results tab.
To stop profiling:
  • Look in the Profiling Stored Procedures, Function, Triggers, and Events display, then

  • click on the Stop Collecting Profiling Information on Selected Databases.
Here's a simple stored procedure with two "hot spots" that take a long time to run, the WAITFOR and the SELECT COUNT_BIG(*):
CREATE PROCEDURE p()
BEGIN

WAITFOR DELAY '00:00:01';

SELECT COUNT_BIG(*) 
  FROM SYSTAB AS A 
       CROSS JOIN SYSTABCOL AS B
       CROSS JOIN SYSUSER AS C;

END;

SELECT * FROM p();

COUNT_BIG()
66452736

Execution time: 14.39 seconds
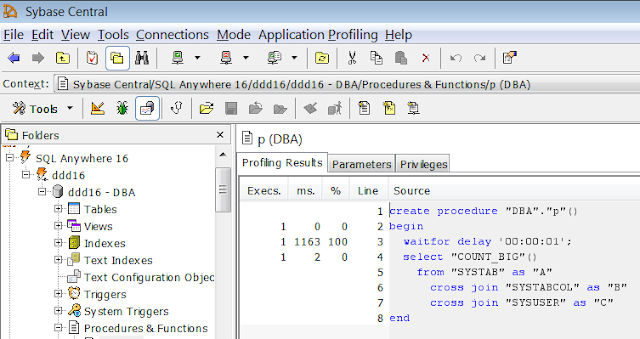
ISQL says the SELECT * FROM p() ran for 14.39 seconds; here's what the procedure profiler says about the call to p():


14.39 seconds versus 1165 milliseconds? How can that be?

Where did the other 13.2 seconds go?

Not anywhere inside p(), at least not according to the procedure profiler:


As expected, 1163 milliseconds are reported against the WAITFOR DELAY '00:00:01' statement, but only 2 milliseconds for the SELECT... it might as well say "zero".

Maybe it's ISQL's fault

The procedure profiler doesn't look inside client applications, and that's what ISQL is: a client application running the SELECT * FROM p() statement. So let's push that SELECT down inside another stored procedure p2() and call that one from ISQL:
CREATE PROCEDURE p2()
BEGIN

WAITFOR DELAY '00:00:01';

SELECT * FROM p();

END;

SELECT * FROM p2();

COUNT_BIG()
66452736

Execution time: 12.967 seconds
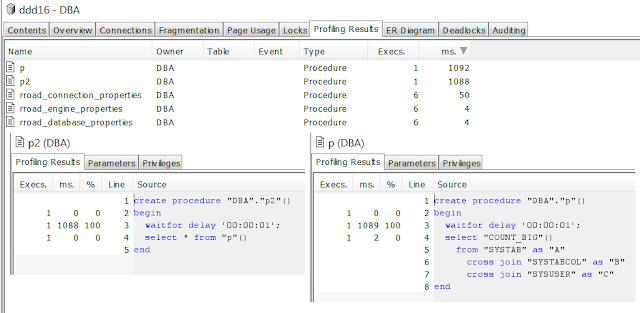
Here's what the procedure profiler has to say about p2() and p()... each one has a WAITFOR that takes about one second, but neither SELECT takes any time at all:


The bottom line is...

You cannot trust the procedure profiler to report the time spent executing SELECT statements that return result sets from stored procedures.

However, you can check those SELECT statements yourself, by going Old School with DATEDIFF() and MESSAGE:
CREATE PROCEDURE p()
BEGIN
DECLARE @t TIMESTAMP;

WAITFOR DELAY '00:00:01';

SET @t = CURRENT TIMESTAMP;
SELECT COUNT_BIG(*) 
  FROM SYSTAB AS A 
       CROSS JOIN SYSTABCOL AS B
       CROSS JOIN SYSUSER AS C;
MESSAGE STRING ( 'SELECT result set: ', DATEDIFF ( MILLISECOND, @t, CURRENT TIMESTAMP ) ) TO CONSOLE;

END;

CALL sa_flush_cache();

SELECT * FROM p();

COUNT_BIG()
66452736

Execution time: 12.522 seconds
Here's what the MESSAGE statement wrote to the SQL Anywhere diagnostic console log:
SELECT result set: 11356
Now you know where the time is going, you can determine why by using the technique described in Capture Plans With GRAPHICAL_PLAN().


Friday, December 6, 2013

The fRiDaY File - It doesn't run MobiLink either

Fans of Pawn Stars will recognize two of the main cast members in this Microsoft commercial . . . this is the full version of the commercial, much better than the 30-second clips currently showing on TV:


Wednesday, December 4, 2013

Latest SQL Anywhere Updates: 12.0.1.3994 HP-UX, IBM AIX, Solaris x64

Current builds for the active platforms...

HP-UX     16.0 GA Dev Edition download       (date n/a)      Dev Edition registration
 Itanium  12.0.1.3994 (EBF 22137 SP66)   *** 02 Dec 2013 ***
          11.0.1.2958 (EBF 21793 SP96)       08 Apr 2013     End of Life 31 May 2014

IBM AIX   16.0 GA Dev Edition download       (date n/a)      Dev Edition registration
          12.0.1.3994 (EBF 22136 SP66)   *** 02 Dec 2013 ***
         11.0.1.2958 (EBF 21792 SP96)       08 Apr 2013     End of Life 31 May 2014

Linux     16.0.0.1691 (EBF 21981 SP6)        31 Oct 2013
          On Demand 1.0.4613 (SP3)           13 Sep 2013
          12.0.1.3994 (EBF 22111 SP66)       27 Nov 2013
          12.0.1 Chinese,                    16 Apr 2013
                 Japanese Docs (Eclipse)     16 Apr 2013
          11.0.1.3027 (EBF 21786 SP98)       13 Sep 2013     End of Life 31 May 2014

Mac OS    16.0.0.1565 (EBF 21800 SP3)        13 Sep 2013
          12.0.1.3958 (EBF 21796 SP64)       19 Sep 2013
          11.0.1.2449 Update                 29 Jun 2010     End of Life 31 May 2014

Solaris   16.0 GA Dev Edition download       (date n/a)      Dev Edition registration
 SPARC    12.0.1.3894 (EBF 21789 SP60)       16 May 2013
          11.0.1.2958 (EBF 21794 SP96)       08 Apr 2013     End of Life 31 May 2014

Solaris   16.0 GA Dev Edition download       (date n/a)      Dev Edition registration
 x64      12.0.1.3994 (EBF 22139 SP66)   *** 02 Dec 2013 ***
          11.0.1.2958 (EBF 21750 SP96)       08 Apr 2013     End of Life 31 May 2014

Windows   16.0.0.1691 (EBF 21980 SP6)        31 Oct 2013
          On Demand 1.0.4613 (SP3)           13 Sep 2013
          12.0.1.3994 (EBF 22109 SP66)       27 Nov 2013
          12.0.1 French,                     25 Sep 2012
                 English,                    25 Sep 2012
                 German,                     25 Sep 2012
                 Chinese,                    28 Mar 2013
                 Japanese Docs (HTML/PDF)    28 Mar 2013
          11.0.1.2960 (EBF 21751 SP97)       16 Apr 2013     End of Life 31 May 2014 

Other Stuff...

 Older Updates

 Free support! Q&A forum
   ...or, call Tech Support

 SQL Anywhere...
   ...Sybase home page 
   ...SAP home page 
   ...SAP Developer Center 

 Buy SQL Anywhere 

 Developer Edition... 
   [16.0] [12.0.1] [11.0.1]

 Download the...
   Educational Edition 
   Web Edition 

 Supported Platforms...
   SQL Anywhere 
   Linux 
   OnDemand

 ODBC Drivers for MobiLink

The asterisks "***" show which items have appeared on the Sybase website since the previous version of this page.
  • Only the latest fully-supported versions of SQL Anywhere (11.0.1, 12.0.1, 16.0 and On Demand) are shown here.

  • The "EBF 21788 SP60" numbers are the new SAP-specific codes associated with the build numbers "12.0.1.3894".

  • Just because an older version or different platform isn't "fully supported" any more doesn't mean you can't download files (or ask questions, or get help), it just means there won't be any more new Updates released.

Monday, December 2, 2013

Evaluating A Candidate For CLUSTERED

Question: How can I tell if a column is a good candidate for a CLUSTERED index?

Glib Answer: Create a clustered index on that column and see if query performance is improved.

Longer Answer: If the rows are inserted in more-or-less the same order as values in the column, and the column appears in predicates that might benefit from a clustered index on that column (such as a BETWEEN range query), then see the Glib Answer above.

Seriously... :)

In SQL Anywhere the CLUSTERED attribute is more of a performance hint than a constraint. In other words, if a clustered index already exists then SQL Anywhere will try to insert new rows in the same physical order as values in the index, but there's no guarantee. And there's REALLY no guarantee if a non-clustered index already exists and you change it with ALTER INDEX:
ALTER INDEX x ON t CLUSTERED;
In fact, that ALTER INDEX will run instantly; SQL Anywhere will not move anything around, and it's up to you to tell the truth about insert ordering if you want good performance.

The flip side is that it's really easy to run ALTER INDEX x ON t CLUSTERED statements, even in production, and see if performance improves; you can always change it back with this:
ALTER INDEX x ON t NONCLUSTERED;
In other words, the Glib Answer ain't so glib after all.

Answer the question!

Sometimes a column is "somewhat clustered", and you'd like to know "how clustered". If the rows are perfectly ordered according to the values in some other column, you can use that fact to check the candidate column; e.g., a PRIMARY KEY DEFAULT AUTOINCREMENT column will perfectly define the row order if the DEFAULT is always used when inserting.

Here's some code showing how to compare the ordering of a candidate column with a DEFAULT AUTOINCREMENT column:
-- DBA.t (table_id 738) in ddd16 - Dec 1 2013 2:31:56PM - Print - Foxhound © 2012 RisingRoad
CREATE TABLE DBA.t ( -- 725,161 rows, 15.5M total = 13.3M table + 0 ext + 2.3M index, 23 bytes per row
   pkey               /* PK        */ INTEGER NOT NULL DEFAULT autoincrement,
   candidate_column                   TIMESTAMP NULL,
   CONSTRAINT ASA78 PRIMARY KEY ( -- 2.3M
      pkey )
 );

WITH ordered_t AS ( SELECT ROW_NUMBER() OVER ( ORDER BY t.pkey ) AS row_number,
                           t.candidate_column
                      FROM t ) 
SELECT 'Disordered row count: ' AS "Row count", 
       COUNT(*)
  FROM ( SELECT * FROM ordered_t ) AS ordered_t1
       INNER JOIN
       ( SELECT * FROM ordered_t ) AS ordered_t2
       ON ordered_t2.row_number = ordered_t1.row_number + 1
 WHERE ordered_t2.candidate_column < ordered_t1.candidate_column 
UNION ALL
SELECT 'Total row count:',
       COUNT(*)
  FROM t;

Disordered row count:  98,790
Total row count:      725,161
  • The WITH clause on lines 9 through 11 creates a local view called ordered_t. That view deals with the fact there may be gaps between adjacent values of t.pkey. It does that by calling ROW_NUMBER() to replace t.pkey with the sequence 1, 2, 3 with no gaps.

  • The FROM clause on lines 14 through 17 joins two copies of the ( SELECT * FROM ordered_t ) view, matching each row in one copy with the next (adjacent) row in the other copy.

  • The WHERE clause on line 18 looks for candidate_column values that are out of order in those adjacent rows.

  • The SELECT on lines 12 through 18 displays how many rows are out of order, and the UNION ALL SELECT on lines 19 through 22 shows the total row count.
The result shows that a quite a few rows are out of order (1 out of 7) so maybe a CLUSTERED index won't help.

Let's try one

Here's a range query that was tested with no index on candidate_column, with a non-clustered index, and with a clustered index. Each test was run twice, with and without capturing a graphical plan, and the database was restarted before each test to eliminate effects of the cache:
SELECT COUNT(*)
  FROM t
 WHERE candidate_column BETWEEN CURRENT DATE - 1000
                            AND CURRENT DATE - 900;
Here are the results:
                                Graphical Plan - Time       ISQL
                                to fetch the first row  Execution Time 
                                ----------------------  --------------

No index on t.candidate_column          0.85942             0.852

CREATE INDEX xcandidate_column          0.50568             0.439
   ON t ( candidate_column )

ALTER INDEX xcandidate_column           0.09796             0.08
   ON t CLUSTERED;
The second column shows the FirstRowRunTime in seconds reported in the graphical plans, and the third column shows what ISQL reported when run without capturing plans. The two columns are consistent, showing that
  • the non-clustered index shaved almost 50% off the no-index execution time, and

  • declaring the index as CLUSTERED reduced the time by 90%.
So... in this case, for the distribution of data in this table, for this particular query... CLUSTERED wins!

Here's a snippet from the graphical plan for the no-index test, showing that an intra-query Parallel Table Scan was used:

The plan for the non-clustered index test shows no more table scan, now it's using a Parallel Index Only Retrieval Scan; remember, it's just counting rows so it doesn't actually have to retrieve anything from the table itself:

The clustered index plan looks exactly the same as the non-clustered index plan, except it says "Clustered index yes"... and it's faster.


Friday, November 29, 2013

Latest SQL Anywhere Updates: 12.0.1.3994 for Linux and Windows

Current builds for the active platforms...

HP-UX     16.0 GA Dev Edition download       (date n/a)      Dev Edition registration
 Itanium  12.0.1.3894 (EBF 21788 SP60)       16 May 2013
          11.0.1.2958 (EBF 21793 SP96)       08 Apr 2013     End of Life 31 May 2014

IBM AIX   16.0 GA Dev Edition download       (date n/a)      Dev Edition registration
          12.0.1.3894 (EBF 21787 SP60)       16 May 2013
          11.0.1.2958 (EBF 21792 SP96)       08 Apr 2013     End of Life 31 May 2014

Linux     16.0.0.1691 (EBF 21981 SP6)        31 Oct 2013
          On Demand 1.0.4613 (SP3)           13 Sep 2013
          12.0.1.3994 (EBF 22111 SP66)   *** 27 Nov 2013 ***
          12.0.1 Chinese,                    16 Apr 2013
                 Japanese Docs (Eclipse)     16 Apr 2013
          11.0.1.3027 (EBF 21786 SP98)       13 Sep 2013     End of Life 31 May 2014

Mac OS    16.0.0.1565 (EBF 21800 SP3)        13 Sep 2013
          12.0.1.3958 (EBF 21796 SP64)       19 Sep 2013
          11.0.1.2449 Update                 29 Jun 2010     End of Life 31 May 2014

Solaris   16.0 GA Dev Edition download       (date n/a)      Dev Edition registration
 SPARC    12.0.1.3894 (EBF 21789 SP60)       16 May 2013
          11.0.1.2958 (EBF 21794 SP96)       08 Apr 2013     End of Life 31 May 2014

Solaris   16.0 GA Dev Edition download       (date n/a)      Dev Edition registration
 x64      12.0.1.3894 (EBF 21790 SP60)       16 May 2013
          11.0.1.2958 (EBF 21750 SP96)       08 Apr 2013     End of Life 31 May 2014

Windows   16.0.0.1691 (EBF 21980 SP6)        31 Oct 2013
          On Demand 1.0.4613 (SP3)           13 Sep 2013
          12.0.1.3994 (EBF 22109 SP66)   *** 27 Nov 2013 ***
          12.0.1 French,                     25 Sep 2012
                 English,                    25 Sep 2012
                 German,                     25 Sep 2012
                 Chinese,                    28 Mar 2013
                 Japanese Docs (HTML/PDF)    28 Mar 2013
          11.0.1.2960 (EBF 21751 SP97)       16 Apr 2013     End of Life 31 May 2014 

Other Stuff...

 Older Updates

 Free support! Q&A forum
   ...or, call Tech Support

 SQL Anywhere...
   ...Sybase home page 
   ...SAP home page 
   ...SAP Developer Center 

 Buy SQL Anywhere 

 Developer Edition... 
   [16.0] [12.0.1] [11.0.1]

 Download the...
   Educational Edition 
   Web Edition 

 Supported Platforms...
   SQL Anywhere 
   Linux 
   OnDemand

 ODBC Drivers for MobiLink

The asterisks "***" show which items have appeared on the Sybase website since the previous version of this page.
  • Only the latest fully-supported versions of SQL Anywhere (11.0.1, 12.0.1, 16.0 and On Demand) are shown here.

  • The "EBF 21788 SP60" numbers are the new SAP-specific codes associated with the build numbers "12.0.1.3894".

  • Just because an older version or different platform isn't "fully supported" any more doesn't mean you can't download files (or ask questions, or get help), it just means there won't be any more new Updates released.

Wednesday, November 27, 2013

Beware The Slow Subquery

Here's a snippet from a very curious graphical plan for a large, slow 4-way UNION in a SQL Anywhere 16 stored procedure:


The selected DT (Derived Table) node represents the 3rd SELECT statement in the UNION, and the Subtree Statistics - PercentTotalCost of 66.979% shows that this SELECT is the slowest of the four.

So, why is it curious?

It's curious because the node immediately below the DT, the JNL Nested Loop Join node, shows a Node Statistics - PercentTotalCost of zero and a Subtree Statistics - PercentTotalCost of only 8%... where did the rest of the 66.979% go?

Did it disappear somewhere between the DT and the JNL?

In an effort to find where the time was going, the third SELECT was moved out of the UNION and executed separately. Here's an even-more-curious snippet from the graphical plan for that SELECT:


The DT node has now become the SELECT node, with 100% for the Subtree Statistics - PercentTotalCost.

However, the Work node immediately underneath the SELECT node shows zero for both the Node and Subtree Statistics - PercentTotalCost.

Now we're not just looking for most of the time, we're looking for ALL the time . . .

Where did it go?

It turns out there's more to this query than one giant SELECT FROM... there are a bunch of subqueries in the SELECT list, and one of them is consuming . . . wait for it . . . 98.88% of the time.

To see the subqueries in the SQL Anywhere Plan Viewer, you have to click on the dropdown list that says "Main Query" and look at the "SubQ" entries, in this case SubQ 4:


Back in the "Main Query" display, the SubQ 4 subquery appears as the third-last item in the SELECT list:
expr166[EXISTS(SubQ 4) : 50% Guess,1,0]
The subquery itself isn't so bad, it only took 0.19238% of the time (the Actual(Avg) column in the Node Statistics above)... it's the 514 separate executions, one for each row in the outer SELECT, that brought the total to 98.88% (the Actual(Total) column).

The solution wasn't so hard, either... one more CREATE INDEX, and the execution time for the stored procedure call dropped from 42 seconds to 3.4 seconds.

But the solution's not the point here... the point is, just because a SELECT contains a dozen tables in the FROM clause doesn't mean that's where the time is going.

And just because the Plan Viewer doesn't shout "Hey, look at this slow subquery!" doesn't mean you shouldn't dig down and look for yourself... especially when the Main Query display doesn't account for all the time being spent.

Note: The plans shown here were obtained using the technique shown in Capture Plans With GRAPHICAL_PLAN().

Monday, November 25, 2013

Capture Plans With GRAPHICAL_PLAN()

Sometimes, you already know where the slow queries are in your stored procedures. Other times, a quick run using SQL Anywhere's procedure profiling feature will tell you.

However, knowing the "what" and "where" of query bottlenecks may not be enough, you also need to know the "why". For that, you need to see the graphical plan with statistics for each slow query... and you often can't simply copy and paste the queries into ISQL to see the plans because you won't get realistic results,

You have to run the procedures in their natural habitat

One way to gather plans at runtime is described in Database Tracing In 50 Easy Steps, but that approach has some drawbacks:
  • The Database Tracing process is painstaking and the resulting number of plans and level of detail is overwhelming,

  • there's no easy way to determine which plans goes with which SQL statements in the stored procedures; in other words, Database Tracing doesn't tell you "where", and

  • the plans are stored in a tracing database rather than written to separate *.saplan files.
Another alternative method is to go Old School: modify the stored procedure code to call GRAPHICAL_PLAN() and xp_write_file for each slow query; here's how...

Step 1: Find a slow SQL statement.

Here's an example of a stored procedure that contains a slow query:
CREATE PROCEDURE slow()
BEGIN
DECLARE @local_variable INTEGER DEFAULT 1;

SELECT 'string literal', 
       @local_variable,
       COUNT_BIG(*) -- trailing comment 
  INTO #temp
  FROM SYSTAB /* embedded comment */ AS A
       CROSS JOIN SYSTAB AS B
       /* multi-line
          comment */
       CROSS JOIN SYSTABCOL AS C;

SELECT *
  FROM #temp;
END;

SELECT * FROM slow();

expression     @local_variable expression1 
-------------- --------------- ----------- 
string literal               1   178123800 
(1 rows)
Execution time: 44.845 seconds
Here's what it looks like in the SQL Anywhere 16 stored procedure profiler:


Step 2: Add code to capture the plan.

Here's the code template for calling GRAPHICAL_PLAN() to capture a graphical plan with statistics from within a stored procedure:
/* START TEMPORARY CODE */
CALL xp_write_file (
   'C:/temp/graphical_plan.saplan',
   GRAPHICAL_PLAN (
      '
[PASTE SQL STATEMENT HERE]
      ',
      2, -- Detailed statistics including node statistics
      'asensitive',
      'READ-ONLY' ) );
/* END TEMPORARY CODE */
Here's how to use the code template...
  • Insert the code template immediately ahead of the slow query in the stored procedure.

  • Copy and paste the slow query where it says [PASTE SQL STATEMENT HERE].

  • Change all embedded single quotes ' to be quote pairs '' (not doublequotes, but two single quotes).

  • References to local variables are OK; so are trailing --comments, embedded /*comments*/ and the closing semicolon.

  • Make sure you preserve the correct functionality of the stored procedure. In particular, make sure it's OK to execute the query twice (once by the GRAPHICAL_PLAN() function, and once by the original SQL statement). In this case, the "INTO #temp" must be removed from the query passed to GRAPHICAL_PLAN() for two reasons; first, so multiple rows aren't inserted to the temporary table by two query executions, and second, because GRAPHICAL_PLAN() fails with SQLCODE=-894 for a query that contains an INTO #temp clause.

  • You may choose to pass only portions of a slow query to GRAPHICAL_PLAN(); for example, the SELECT portion of a DELETE SELECT, or one of many SELECT statements in a large UNION.

  • You may also choose to code multiple CALL xp_write_file statements, with different *.saplan file names, for multiple slow queries or separate portions of one slow query.
Here's what the slow() procedure looks like after the code's been added:
CREATE PROCEDURE slow()
BEGIN
DECLARE @local_variable INTEGER DEFAULT 1;

/* START TEMPORARY CODE */
CALL xp_write_file (
   'C:/temp/graphical_plan.saplan',
   GRAPHICAL_PLAN (
      '
SELECT ''string literal'', 
       @local_variable,
       COUNT_BIG(*) -- trailing comment 
--  INTO #temp
  FROM SYSTAB /* embedded comment */ AS A
       CROSS JOIN SYSTAB AS B
       /* multi-line
          comment */
       CROSS JOIN SYSTABCOL AS C;
      ',
      2, -- Detailed statistics including node statistics
      'asensitive',
      'READ-ONLY' ) );
/* END TEMPORARY CODE */

SELECT 'string literal', 
       @local_variable,
       COUNT_BIG(*) -- trailing comment 
  INTO #temp
  FROM SYSTAB /* embedded comment */ AS A
       CROSS JOIN SYSTAB AS B
       /* multi-line
          comment */
       CROSS JOIN SYSTABCOL AS C;

SELECT *
  FROM #temp;
END;

SELECT * FROM slow();

Step 3: Run the procedure to capture the plan.

Here's what graphical_plan.saplan looks like in the SQL Anywhere 16 plan viewer:


Wednesday, November 20, 2013

Fast Random File Read With xp_read_file()

The description of the new READ_SERVER_FILE() procedure introduced in SQL Anywhere 16.0.0.1675 leads one to ask the question, "What makes READ_SERVER_FILE() different from the good old xp_read_file()?

One obvious difference is that READ_SERVER_FILE() lets you specify a substring of the file while xp_read_file() doesn't.

Another difference is that xp_read_file() has a mysterious "lazy" parameter that was introduced in Version 12 of SQL Anywhere:

Enhancements to the xp_read_file system procedure
The xp_read_file system procedure now includes an optional parameter that allows you to specify lazy reads. When you specify this optional parameter and its value is not zero, the file is read and then immediately unlocked.

Did you understand that?

No, neither did I, which might be why this new feature didn't get mentioned in the Top 10 Features in SQL Anywhere 12.

Experimentation shows that the xp_read_file "lazy" parameter might as well be called "fast" if you're interested in reading small substrings from large files; here's how you can use it:
  • Execute a SET @variable = xp_read_file ( 'filespec', 1 ) statement to open the file but NOT actually read all the data into @variable.

  • Read substrings of data from the file via SUBSTR ( @variable, @start, @length ) calls.
Here are the effects:
  • Both operations, the xp_read_file() call and the SUBSTR(), are much faster with lazy = 1 than with the default lazy = 0 . . . not just one of them is faster, but both of them are.
    Lazy xp_read_file() call          .28900 seconds.
    Lazy SELECT SUBSTR()              .32400 seconds.
    Non-lazy xp_read_file() call    74.70200 seconds.
    Non-lazy SELECT SUBSTR()       211.44400 seconds.
    

  • Setting lazy = 1 effectively implements the substring start and length parameters introduced with the new READ_FILE_SERVER() procedure.

  • For large files and small substrings, setting lazy = 1 virtually eliminates extreme RAM cache growth. In some cases this makes the difference between success and an unresponsive server.
Here's the code for the two tests:
-- Lazy test of 352485376 bytes

BEGIN
DECLARE @large_file_1  LONG VARCHAR;
DECLARE @substring_1   VARCHAR ( 100 );
DECLARE @started_at    TIMESTAMP;

MESSAGE STRING ( 'Lazy test starting.' ) TO CONSOLE;

SET @started_at = CURRENT TIMESTAMP;
SET @large_file_1 = xp_read_file ( 'D:/Foxhound1 - 3738 after long benchmark tests/foxhound1.db', 1 );
MESSAGE STRING ( 
   'Lazy xp_read_file() call took ',
   DATEDIFF ( MILLISECOND, @started_at, CURRENT TIMESTAMP ) / 1000.0,
   ' seconds.' ) TO CONSOLE;

SET @started_at = CURRENT TIMESTAMP;
                                
SELECT SUBSTR ( @large_file_1, 200000000, 100 );
MESSAGE STRING ( 
   'Lazy SELECT SUBSTR() took ',
   DATEDIFF ( MILLISECOND, @started_at, CURRENT TIMESTAMP ) / 1000.0,
   ' seconds.' ) TO CONSOLE;

END;

Now accepting requests
Cache size adjusted to 6816K
Cache size adjusted to 8532K
Lazy test starting.
Lazy xp_read_file() call took .28900 seconds.
Lazy SELECT SUBSTR() took .32400 seconds.

SUBSTR(@large_file_1,200000000,100)
'N@SiyŒŸ²ÅØë¨G$7J]pƒ–©¼Ïâõ\x08\x1b/ATgz\x8d ³ÆÙìÿ\x12%8K^q ... '
-- Non-lazy test of 352485376 bytes

BEGIN
DECLARE @large_file_2  LONG VARCHAR;
DECLARE @substring_2   VARCHAR ( 100 );
DECLARE @started_at    TIMESTAMP;

MESSAGE STRING ( 'Non-lazy test starting.' ) TO CONSOLE;

SET @started_at = CURRENT TIMESTAMP;
SET @large_file_2 = xp_read_file ( 'D:/Foxhound1 - 3738 after long benchmark tests/foxhound1.db', 0 );
MESSAGE STRING (
   'Non-lazy xp_read_file() call took ',
   DATEDIFF ( MILLISECOND, @started_at, CURRENT TIMESTAMP ) / 1000.0,
   ' seconds.' ) TO CONSOLE;

SET @started_at = CURRENT TIMESTAMP;
SELECT SUBSTR ( @large_file_2, 200000000, 100 );
MESSAGE STRING ( 
   'Non-lazy SELECT SUBSTR() took ',
   DATEDIFF ( MILLISECOND, @started_at, CURRENT TIMESTAMP ) / 1000.0,
   ' seconds.' ) TO CONSOLE;

END;

Now accepting requests
Cache size adjusted to 8008K
Cache size adjusted to 8808K
Non-lazy test starting.
Cache size adjusted to 9192K
Cache size adjusted to 53956K
Cache size adjusted to 257692K
Cache size adjusted to 409424K
Cache size adjusted to 825356K
Non-lazy xp_read_file() call took 74.70200 seconds.
Non-lazy SELECT SUBSTR() took 211.44400 seconds.
Cache size adjusted to 1282136K

SUBSTR(@large_file_2,200000000,100)
'N@SiyŒŸ²ÅØë¨G$7J]pƒ–©¼Ïâõ\x08\x1b/ATgz\x8d ³ÆÙìÿ\x12%8K^q ... '